


Economic Survey 2020-21
- DR. Meenal Shah
- May 24, 2021
- 13 min read

Tips to Read the Economic Survey:
• Read after a basic study: Students should have a basic understanding of economics, especially the basic terms like GDP, inflation, fiscal drag, etc. before moving on to studying the Economic Survey.
• Read the Preface thoroughly: The Preface of the Economic Survey is like a summary of the document. Reading it will help you get an essence of what is inside and help you understand it better.
• Boxes and Arguments: The document contains many boxes that are particularly important for the UPSC exam. From here, questions have been asked directly. Also, the data can be used to augment and support your answers. The Survey also gives arguments such as why a scheme or initiative is important, how it can be bettered, and also recommendations, which can be used in the mains answers.
• Break into small topics: If you think reading the Economic Survey is overwhelming, it can be covered easily by breaking into smaller topics. You can categorize the content in the Survey into topics such as welfare schemes, macroeconomic tangibles, and demographics, agriculture, urbanization, social empowerment, figures (like unemployment data, GDP, inflation, food inflation, fiscal deficit, current account deficit, the balance of payments, foreign reserves, trade balance, etc.)
You can categorize the content in the Survey into topics such as
• welfare schemes,
• macroeconomic tangibles, (GDP, inflation, food inflation, fiscal deficit, current account deficit, the balance of payments, foreign reserves, trade balance, etc.)
• demographics, agriculture,
• urbanization,
• social empowerment,
but if you feel that reading whole economic survey is a tedious job here we presenting the summery and all important points of economic survey 2020-21and these all are very important for all competitive exams
What is Economic Survey
The Economic Survey is nothing but an annual document prepared by advisers to the finance minister and tabled in the parliament a day before the Union budget.
Economic Survey is the first document tabled in the Parliament after the beginning of the Budget session
It is a review of the developments in the Indian economy over the previous 12 months.
The survey is essentially a summary of the performance on major development programs, and highlights the policy initiatives of the government and the prospects of the economy in the short to medium term.
Note that government is not bound to follow its recommendations.
The Economic Survey reviews the
• Developments in the Indian economy
• Highlights the policy initiatives of the government,
• Summarizes the performance on major development programs,
• Shows the growth prospects of the economy.
• The issues appraised in the Economic Survey and reforms suggested are often implemented by the government in future initiatives
Two volumes of economic survey : economic survey consist of two
Volume 1
• It attempts to capture ideas that –
• Summarize the current economic trends.
• Provides evidence based economic analyses of the recent economic developments
Volume 2
• It reviews recent developments in the major sectors of the economy.
• It is supported by the relevant statistical tables and data.
• This would serve as the ready-reckoner for the existing status and the policies in a sector.
The foundational theme of survey as a result of this pandemic has been
“Saving life and livelihoods”

Major highlights
Contact based services, Manufacturing, construction hit hardest by pandemic.
Agriculture has remained the silver lining.
Govt consumption and net exports have cushioned the growth from diving further down.
V – shaped economic recovery supported by mega vaccination drive.
India to log 2%current account surplus; first positive balance in 17 year.
In two years India could be the fastest growing economy as per IMF.
Survey calls for more active, countercyclical fiscal policies.
Chapter 1 Saving Lives and Livelihoods admits a Once - in - a - Century Crisis

Stringency Index for States in India- Objective of the stringency index is to capture the strictness of ‘lockdown style’ policies of respective States that primarily restrict people’s behavior.
Table 4 is quite important where it referred about Major Structural Reforms Undertaken as a Part of Atmanirbhar Bharat Package.


Chapter 2 Dose growth leads to Debt Sustainability? Yes but not visa – versa!
• This Chapter establishes clearly that growth leads to debt sustainability in the Indian context but not necessarily vice-versa.
• Debt sustainability depends on the “interest rate growth rate differential” (IRGD), i.e. the difference between the interest rate and the growth rate in an economy.
• This chapter examines the optimal stance of fiscal policy in India during a crisis and establishes that the growth leads to debt sustainability in the Indian context and not necessarily vice-versa.
• In a country like India, which has a large workforce employed in the informal sector, counter-cyclical fiscal policy becomes even more paramount.

Numerous studies in economic literature establish this relationship both theoretically and empirically. Ozkan and McManus (2015) study the impact of cyclicality of fiscal policy on macroeconomic outcomes for 114 countries over 1950–2010 and establish that following a procyclical fiscal stance leads to lower economic growth, higher volatility in output and higher levels of inflation. In contrast a counter-cyclical fiscal policy stance with policy actions against the cycle acts as a stabilizer by reducing output volatility and keeping growth on a steady path.

However, for emerging economies such as India, an increase in public expenditure in areas that boost private sector’s propensities to save and invest, may enable private investment rather than crowding it out. In other words, in an economy that has unemployed resources, an increase in government spending increases the aggregate demand in the economy, which may induce the private sector to increase their investment in new machinery to cater to the increased demand, and hence put the unused resources to productive uses. This may have multiplier effects on aggregate demand, resulting in higher growth rates (Eisner, 1994). In fact, if the public expenditure is directed to sectors where the fiscal multipliers are large – for instance for building infrastructure – such spending may significantly crowd in private investment as well.

Chapter 3 - Does India’ s Sovereign Credit Rating Reflect its Fundamentals? No.
What Is a Sovereign Credit Rating?
A sovereign credit rating is an independent assessment of the creditworthiness of a country or sovereign entity. Sovereign credit ratings can give investors insights into the level of risk associated with investing in the debt of a particular country, including any political risk.
At the request of the country, a credit rating agency will evaluate its economic and political environment to assign it a rating. Obtaining a good sovereign credit rating is usually essential for developing countries that want access to funding in international bond markets.
• From Box-2 – When a credit rating agency downgrades a country’s sovereign debt, all debt instruments in that country may have to be downgraded accordingly because of the sovereign ceiling doctrine. Commercial banks downgraded to sub-investment grade will find it costly to issue internationally recognized letters of credit for domestic exporters and importers, isolating the country from international capital markets.
• Downgrading corporate debt to sub-investment grade means that firms will face difficulties issuing debt on international capital markets”

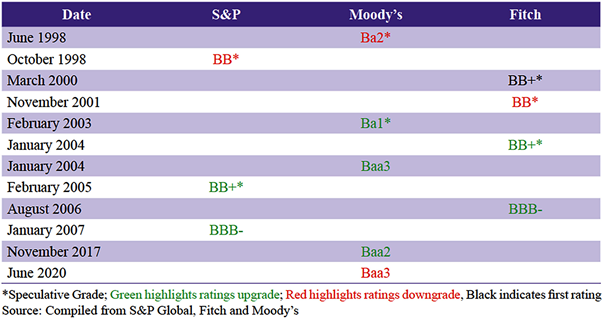
The survey noted that India’s credit rating does not reflect the country’s fundamentals in terms of GDP growth, inflation, government debt as a % of GDP, among others. It observed a bias in ratings against emerging economies like India and China. Credit rating maps the probability of default, reflecting the willingness and ability of borrower to meet debt obligations. India has no history of sovereign default (demonstrating willingness to pay), and the foreign exchange reserves are greater than the total external debt of the country (demonstrating ability to pay). Poor sovereign credit ratings have adverse impact on inflow of foreign investments.
• Sovereign rating depends upon:
• GDP growth rate, inflation, general government debt (as per cent of GDP),
• cyclically adjusted primary balance (as per cent of potential GDP),
• current account balance (as per cent of GDP), political stability, rule of law, control of corruption, investor protection, ease of doing business, short-term external debt (as per cent of reserves), reserve adequacy ratio and sovereign default history
India’s sovereign Credit Rating (1998-2020)


Chapter 4 - Inequality and Growth: Conflict or Convergence?
• Some commentary, especially in advanced economies post the Global Financial Crisis, argues that inequality is no accident but an essential feature of capitalism. Could the fact that both the absolute levels of poverty and the rates of economic growth are low in advanced economies generate this conflict?
• In this chapter, the Survey examines if inequality and growth conflict or converge in the Indian context. this chapter finds that economic growth has a far greater impact on poverty alleviation than inequality. Therefore, given India’s stage of development, India must continue to focus on economic growth to lift the poor out of poverty by expanding the overall pie.
WHAT GOVERNMENT IS TRYING TO SAY?
1. Survey highlights that both income per capita (as a proxy for economic growth) and inequality have similar relationships with socio-economic indicators.
2. Unlike in advanced economies, in India economic growth and inequality converge in terms of their effects on socio-economic indicators.
3. this chapter finds that economic growth has a far greater impact on poverty alleviation than inequality. Therefore, given India’s stage of development, India must continue to focus on economic growth to lift the poor out of poverty by expanding the overall pie.
4. Moreover, that this policy focus does not imply that redistributive objectives are unimportant, but that redistribution is only feasible in a developing economy if the size of the economic pie grows.

Chapter 5 Healthcare takes centre stage, finally!
India has one of the highest levels of out-of-pocket expenses as a share of total health expenditure. The survey observes that increasing the spending on public health from 1% of GDP to 2.5-3% of GDP will help in reducing the out-of-pocket expenses from 65% to 30%.
The survey noted that mitigating information asymmetry in the healthcare sector will help in achieving lower insurance premiums and better welfare of people. It recommends setting up a regulator for the healthcare sector to prevent market failures due to information asymmetry (specifically in private healthcare sector).

• Following the Covid-19 pandemic, a key portfolio decision that healthcare policy must make is about the relative importance placed on communicable versus non-communicable diseuses.
• preventing communicable diseases requires focus on better sanitation and drinking water, which the Swachh Bharat and the Har Ghar Jal Abhiyan campaigns are focusing on.

Chapter 6- Process Reforms: Enabling decision-making under uncertainty
Even when there is no dispute/litigation and allpaperwork is complete, it takes 1570 days to be stuck off from the records. This is an order of magnitude longerthan what it takes in other countries. The ‘World Rule of Law Index’ published by the World
Justice Project.


SOLVING FOR DISCRETION
(a) Strengthen ex-ante accountability.
(b) Bring transparency in the decision-making process.
(c) Build resilient ex-post resolution mechanism.
• Government merged the existing 29 labour laws into 4 labour codes. The code on wages was passed in July 2019. in September 2020, three bills (1) industrial Relations code, 2020, (2) Code on Occupational Safety, health and working Conditions Bill, 2020 (3) Social Security Code, 2020 were passed in the parliament.
• All India Handloom Board, All India Handicrafts Board, Cotton Advisory Board and Jute Advisory Board have been closed. Similarly, the government approved merger of four of its media units, namely Films Division, Directorates of Film Festivals, National Film Archives of India and children Film Society, India into the National Film Development Corporation (NFDC) Ltd.
Chapter 7- Regulatory Forbearance :An Emergency Medicine, Not Staple Diet!
During an economic crisis, adoption of regulatory forbearance could help ease stress in the financial sector. Regulatory forbearance includes measures such as allowing banks to restructure certain loans rather than change the asset classification. The survey suggests that such measures must be withdrawn in a timely manner. It was noted that regulatory forbearance was adopted after the Global Financial Crisis in 2008 for seven years. This led to an increase in non-performing assets and reduced credit growth once the measures were withdrawn. The survey observed that withdrawal of regulatory forbearance must be followed by a review of the quality of the bank’s assets, and capitalisation to ensure growth in lending.

Regulatory forbearance for banks involved relaxing the norms for restructuring assets, where restructured assets were no longer required to be classified as Non- Performing Assets (NPAs henceforth) and therefore did not require the levels of provisioning that NPAs attract.
Given relaxed provisioning requirements, banks exploited the forbearance window to restructure loans even for unviable entities, thereby window dressing their books.
ADVERSE IMPACT OF FORBEARANCE ON BANK PERFORMANCE AND LENDING
Undercapitalization of Banks
Lending to Zombie Firms
Ever-greening of Loans
Weakening of Corporate Governance in Borrowers benefitting from forbearance
Deterioration in the Quality of the Board
Inefficient allocation of capital by borrowers that benefited from Forbearance
Mis-appropriation of resources in borrowers that benefited from forbearance
Deterioration in performance of borrowers benefiting from forbearance
Increased defaults by borrowers benefitting from forbearance
Chapter 8- Innovation: Trending Up but needs thrust, especially from the Private Sector
• India ranked 48 in Global Innovation Index in 2020, which makes it first among Central and South Asian countries, and third among the lower middle-income economies. However, India’s gross domestic expenditure on research and development (GERD) is lowest amongst larger economies. India spends 0.7% of GDP on GERD as compared to the expenditure of over 2% of GDP by China and over 2.5% of GDP in the United States of America.
• Currently, the government sector contributes 56% of the total GERD, which is higher than the contribution of the government sector (20%) in top ten economies (such as China, United Kingdom, and Japan). The contribution by business sector to GERD in India is 37%, which is significantly lower than the contribution of the sector in other large economies (68%). The survey observes that GERD should be increased to over 2% of GDP by enhancing research and development facilities, especially in the private sector.

The GII is co-published by Cornell University, INSEAD, and the World Intellectual Property Organization (WIPO), a specialized agency of the United Nations. It seeks to assist economies in evaluating their innovation performance.


India’s performance on pillars of the global innovation Index 2020 (Rank)


GII Performance (2013-20)

Chapter 9 - JAY Ho: Ayushman Bharat's Jan Arogya Yojana (JAY) and Health Outcomes
• This chapter demonstrates strong positive effects on healthcare outcomes of the Pradhan Mantri Jan Arogya Yojana (PM-JAY) – the ambitious program launched by Government of India in 2018 to provide healthcare access to the most vulnerable sections.
• The scheme provides for secondary and tertiary hospitalization through a network of public and empanelled private healthcare providers. It also provides for three days of pre-hospitalization and 15 days of posthospitalization expenses, places no cap on age and gender, or size of a family and is portable across the country. It covers 1573 procedures including 23 specialties. AB-PM-JAY also aims to set up 150,000 health and wellness centres to provide comprehensive primary health care service to the entire population.
• As PMJAY was implemented in 2018, health indicators measured by National Family Health Surveys 4 (in 2015-16) and 5 (in 2019-20) provide before-after data to assess this impact. To mitigate the impact of various confounding factors that may be contemporaneously correlated with the adoption of PM-JAY, we compute a difference-in-difference by comparing states that implemented PM-JAY versus those that did not. We undertake this analysis in two parts. First, we use West Bengal as the state that did not implement PMJAY and compare its neighboring states that implemented PM-JAY – Bihar, Sikkim and Assam.


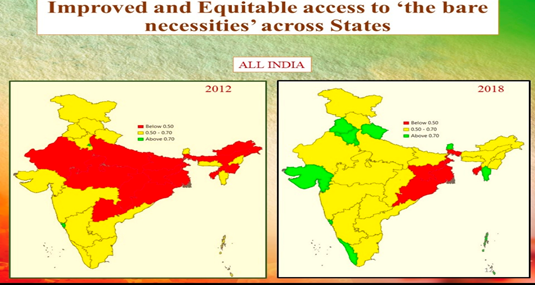
Chapter 10 - The Bare Necessities
Box 1: Government Schemes for Bare Necessities
Swachh Bharat Mission-Rural and Urban
Pradhan Mantri Awaas Yojana (PMAY)
NRDWP, now Jal Jeevan Mission (JJM)
Sahaj Bijli Har Ghar Yojana – Saubhagya
Pradhan Mantri Ujjwala Yojana (PMUY)
Box 2: The Bare Necessities Index
Water (6*)
Sanitation (5*)
Housing (3*)
Micro-environment (4*)
Other Facilities (8*)

IMPORTANT POINTS
India enters among top 50 innovating countries; improves rank from 81 to 48 on Global Innovation Index. The GII is co-published by Cornell University, INSEAD, and the World Intellectual Property Organization (WIPO), a specialized agency of the United Nations. It seeks to assist economies in evaluating their innovation performance
Govt. raises Rs 15,220 cr from disinvestment against FY21 target of Rs. 2.1 lakh crore.
Bid for private trains likely to be completed by May 2021; Pvt trains likely to be introduced in 2023 – 24.
Elevated stock market levels raise concerns on gap between financial and real sector.
Bangladesh poised to emerge as dominant exporter, holds a lesson for India – CAGR of 8.6% during 2011 – 2019, 0.9 % for India, and 0.4% for the world.
PLI scheme to make India integral part of global supply chain.
Survey suggests change in weightage of food items to gauge true picture of inflation.

Gross Domestic Product (GDP): The survey estimates nominal GDP growth of 15.4% and real GDP growth of 11% in 2021-22. In 2020-21, GDP declined by 23.9% in the first quarter and by 7.5% in the second quarter. Overall, GDP is expected to decline by 7.7% in 2020-21 as compared to the growth of 4.2% in 2019-20.
Inflation: The Consumer Price Index (CPI) based inflation was 6.6% in 2020-21 (April-December). The inflation mainly due to food inflation which increased from 6.7% in 2019-20 to 9.1% in 2020-21 (April-December).
Current account surplus: In the first half of 2020-21, the current account surplus was 3.1% of GDP. The survey expects current account surplus to be at least 2% of the GDP by end of 2020-21. If achieved, this will break a 17-year trend of current account deficits. The surplus is due to reduction in merchandise imports and lower expense on travel services, which led to higher decline in current payments (30.8%) as compared to the decline in current receipts (15.1%).
Fiscal deficit: As of November 2020, the fiscal deficit was 135.1% of budget estimate. In comparison, between April to November 2019, fiscal deficit was 114.8% of the budget estimate. The survey noted that the country was fiscally strained due to the disruptions caused by the COVID-19 pandemic.
Agriculture: In 2020-21, the growth rate of agriculture is estimated to be 3.4%. While the contribution of the sector to Gross Value Added (GVA) declined from 18.3% to 17.8% between 2014-15 and 2019-20, it is estimated to increase to 19.9% in 2020-21. This is because the agricultural sector faced fewer disruptions on account of the COVID-19 pandemic as compared to non-agricultural sectors.
Industrial Growth: The industrial sector is estimated to decline by 9.6% in 2020-21. Within the sector, highest decline is estimated in construction (12.6%) and mining (12.4%). The contribution of the industrial sector to GVA has declined from 32.5% in 2011-12 to 25.8% in 2020-21
The Index of Industrial Production (IIP) growth declined by 15.5% between April-November 2020 as compared to growth of 0.3% during same period in 2019. IIP is a measure of industrial performance that assigns a weight of 78% to manufacturing, 14% to mining, and 8% to electricity. Out of 407 items in IIP, the number of items which observed growth increased from 28 in April 2020 to 171 in November 2020, thereby, indicating a sharp economy recovery.
Service Sector
▪ In 2020-21, the service sector is estimated to contract by 8.8% (with trade and hospitality contracting the most (21.4%)) as compared to 5.5% growth in 2019-20. Software services was the only sub-sector with positive growth (3.6%) in the period of April-September 2020.
▪ While the pandemic led to a global slowdown in trade, the Indian service sector export remained resilient. The net services export receipts in first half of 2020-21 was USD 41.67 billion, which is 3% higher than the service export receipts in first half of 2019-20 (USD 40.47 billion).
Tips to Read the Economic Survey:
• Read after a basic study: Students should have a basic understanding of economics, especially the basic terms like GDP, inflation, fiscal drag, etc. before moving on to studying the Economic Survey.
• Read the Preface thoroughly: The Preface of the Economic Survey is like a summary of the document. Reading it will help you get an essence of what is inside and help you understand it better.
• Boxes and Arguments: The document contains many boxes that are particularly important for the UPSC exam. From here, questions have been asked directly. Also, the data can be used to augment and support your answers. The Survey also gives arguments such as why a scheme or initiative is important, how it can be bettered, and also recommendations, which can be used in the mains answers.
• Break into small topics: If you think reading the Economic Survey is overwhelming, it can be covered easily by breaking into smaller topics. You can categorize the content in the Survey into topics such as welfare schemes, macroeconomic tangibles, and demographics, agriculture, urbanization, social empowerment, figures (like unemployment data, GDP, inflation, food inflation, fiscal deficit, current account deficit, the balance of payments, foreign reserves, trade balance, etc.)
You can categorize the content in the Survey into topics such as
• welfare schemes,
• macroeconomic tangibles, (GDP, inflation, food inflation, fiscal deficit, current account deficit, the balance of payments, foreign reserves, trade balance, etc.)
• demographics, agriculture,
• urbanization,
• social empowerment,

Comments